A really delightful time exploring some of our gorgeous Victorian regions is how I best describe my summer holidays. It’s a work in progress, because I’m accompanied by my laptop and, well, real estate never really stops. I consider each stay a hybrid rest/field trip.
We’ve enjoyed little stays in varied locations and each have their own charm and experiences on offer. From Colac-Otways to MItchell Shire, Ballarat, Macedon Ranges, Surf Coast, Great Ocean Road to Bellarine Peninsula, it’s been special.
It’s also been intriguing.
I have spent much of 2020 and 2021 assisting sea-changers and tree-changers so it was eye-opening to experience a stay in so many target areas. The disparity between two nearby holiday towns, however got me thinking about the demographic profiles of each town and prompted this blog.
Our two separate visits to Portarlington and Point Lonsdale had me puzzled. The coal face experience was so different despite both being Bellarine Peninsula destinations, and separated by a mere 21km distance. Portarlington had more holiday visitor things on offer, from a pop-up piano bar to a new pub beer garden, and a vast array of places to dine. The Woolworths supermarket was definitely overcrowded and brimming with holiday visitors dropping in to stock up fridges and esky’s, and the restaurants and cafes catered to a wide range of dining budgets. Arguably the busiest cafe over our five day stay Daniel’s Donuts; boasting twenty minute wait queues for their coffee and donut fixes.
Point Lonsdale, just as charming and as welcoming as it’s northern neighbour, offered a very different holiday experience. Local population count for each is not too dissimilar. Portarlington is larger with ~3600 locals, while Point Lonsdale’s population count sits at ~2700.
Point Lonsdale felt very wealthy. Trendy new builds were on every street. Imported cars were over-represented, and the food options in town were limited, artisan, and expensive.
Glorious, yes. Mainstream, no.
I looked up the median house price data and recent capital growth rates. The median house price differential was marked between both suburbs. However, the recent capital growth rate was so different. Median age looked interesting at first, as Point Lonsdale’s registered median age is 59, (according to ABS 2016 Census data), but a quick scan down the charts alerted me to a really important figure: the occupancy of dwellings in the suburb.
Point Lonsdale’s local occupancy rate was only 45%; less than half of the houses in this suburb are actually home to locals.
Looking at median household incomes offers no accurate guide, because Census data only collects incomes based on where the income-earner declares they live permanently.
I wondered, “is the prevalence, (or existence) of a local caravan park a driver or determinant of a more varied visitor experience?” In other words, does the larger visitor contingent experiencing more affordable holiday accommodation create a demand for more diversely priced array of food and a greater range of entertainment?
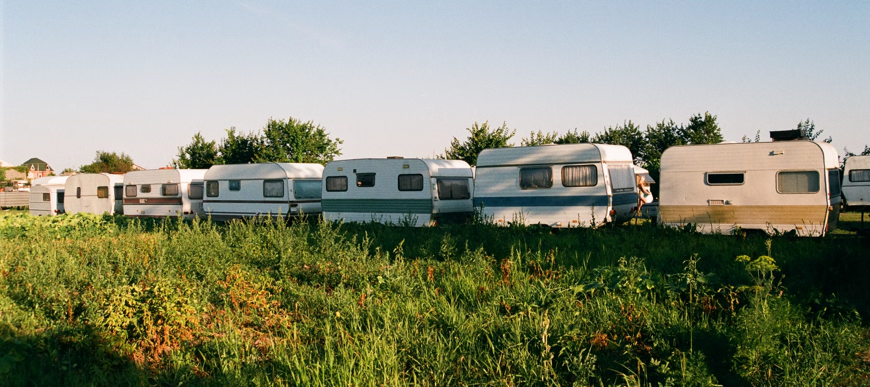
And does a stronger mass of visitors influence the property market or the capital growth rate of a suburb?
I decided to embark on a little study. I selected many of the suburbs we’ve had the pleasure of assisting our clients in, and ensured that each were roughly within a 90 minute commute from Melbourne. We’ve had some outliers, but broadly speaking, most of our sea-change and tree-change briefs have been within this commute distance.
I mapped out the following and overlayed each element across fourteen coastal suburbs of interest; each within the Bellarine and Mornington Peninsula’s, the Surf Coast and Westernport Bay;
- Past five years’ capital growth for houses,
- Median age of the inhabitants,
- Median weekly household income,
- Occupancy rates,
- Current median house values, and
- Whether the suburb had a holiday tourist caravan park
Two columns was deemed unreliable in terms of offering relevant insights. I couldn’t rely on median household incomes or median ages if occupancy rates for permanent inhabitants were low.
Six of the fourteen suburbs exhibited less than a 50% occupancy rate, and Portsea came in at a whopping 87% unoccupied count. That means that (in 2016*), only 13% of residents in Portsea were locals and the others were all at home in their principle places of residence elsewhere on Census night.
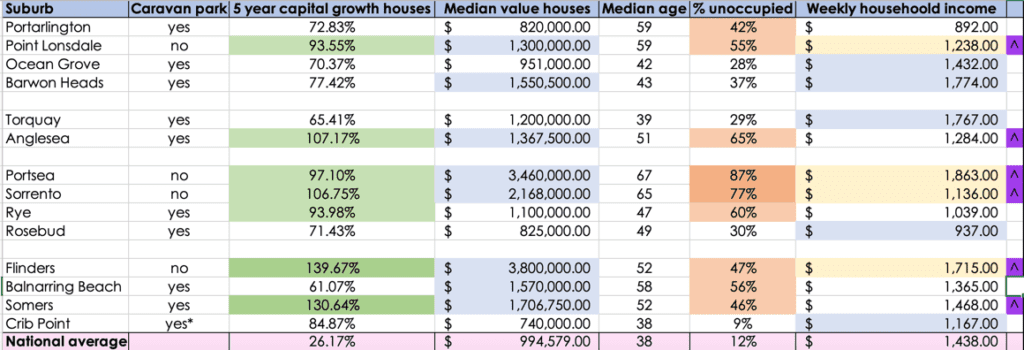
I marked out those suburbs in orange that exhibited over a 40% unoccupied count.
I then focused on the top 50% performers based on a five year rate of house price capital growth#; shaded in green.
I highlighted the highest 50% median house price suburbs in blue ##, (note weekly household income in blue is highlighted for those suburbs exhibiting a greater than 60% occupancy rate, as this data is considered slightly more reliable).
The conclusion was that of the seven suburbs that exhibited the strongest five year capital growth, all but one (Rye) also exhibited the highest median value house prices, and all exhibited a disproportionately high rate of unoccupied, (or holiday house) dwellings.
Does capital growth favour those suburbs with a lower percentage of locals?
The presence of a caravan park was inconclusive in terms of whether it influenced capital growth rates or median house prices, but of the seven highest capital growth suburbs, the four no-caravan park suburbs were all within this group, (in yellow).

As we wait it out in the year following our most recent Census data collection, it will be exciting to assess the 2021 data and contrast it to the prior Census statistics. This study highlights the transfer of wealth into holiday houses, but genuine sea-change moves will shine an important spotlight on how COVID and changes to work arrangements have really fuelled our most recent regional growth.
Sources:
#capital growth sourced from Smart Property
##median prices sourced from REA
All other data sourced from ABS
REGISTER TO OUR NEWSLETTER
INFORMATION
CONTACT US
1A/58 ANDERSON STREET,
YARRAVILLE VIC 3013
0422 638 362
03 7000 6026
CATE@CATEBAKOS.COM.AU