Every quarter, Core Logic prepare a ‘Pain and Gain’ report on the Australian property market. The data breakdown is quite granular, capturing local government areas and segmenting houses and units.
Sometimes the data is quite telling, and this first quarter of 2024 is interesting. The headline figures were reasonably encouraging. “
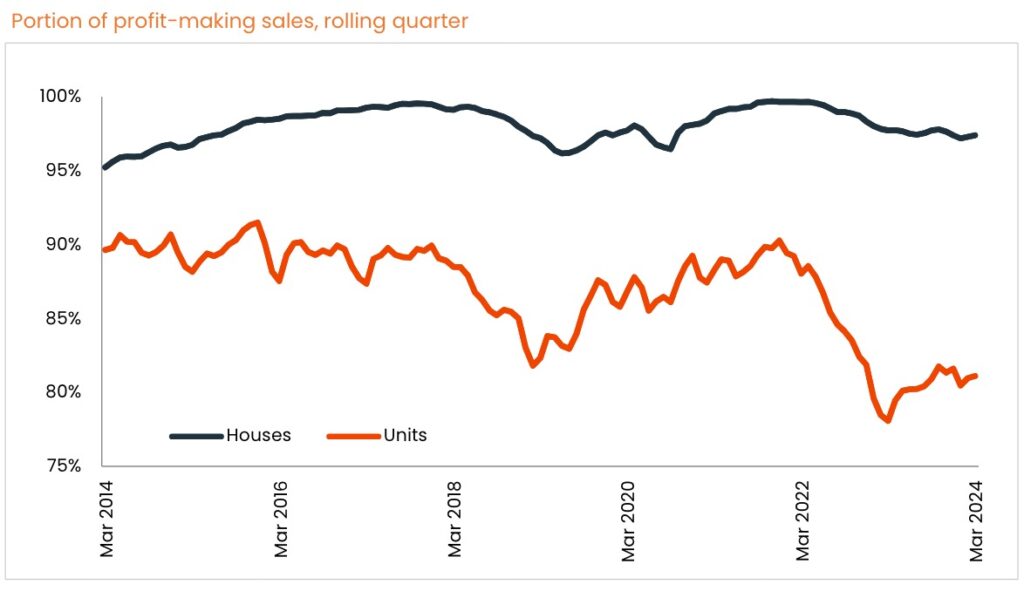
“The rate of profit-making sales reached 94.3%, out of approximately 85,000
sales. Not only does this mark another rise in profitability, but it is the highest rate of
profit-making sales since July 2010. The increase in profitability comes amid home values nationally hitting fresh record highs each month since November 2023.” (Core Logic)
However, while 97.1% of house sales nationally produced profits, unit sale profits sat at just 89%.
As this chart shows though, unit losses were more severe in previous years and it could be argued that the chart shows a small uptick in profitability (red line).
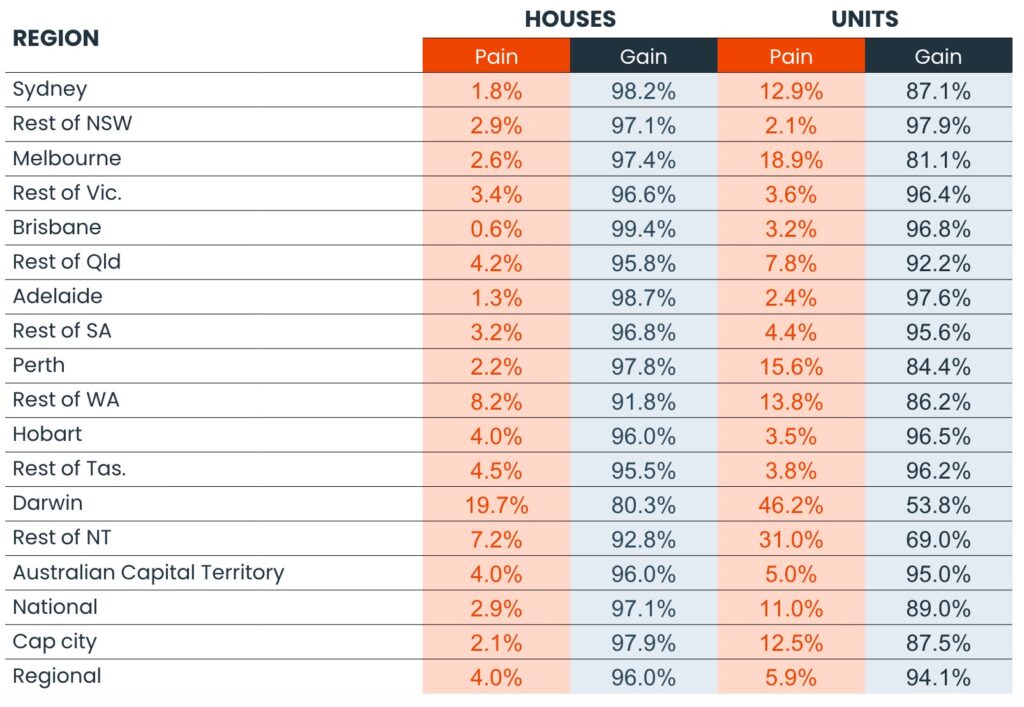
The state and territory breakdown is interesting. While most of us would have assumed Victoria’s house losses could outstrip most other states and territories, it’s actually Northern Territory, WA and QLD that have delivered the highest levels of loss making house sales.
However, for Melbourne it’s unit sales that tell a different story. As a capital city, it’s Darwin that wins the gong for unit pain, but Perth and Sydney exhibit a fair share of pain also.
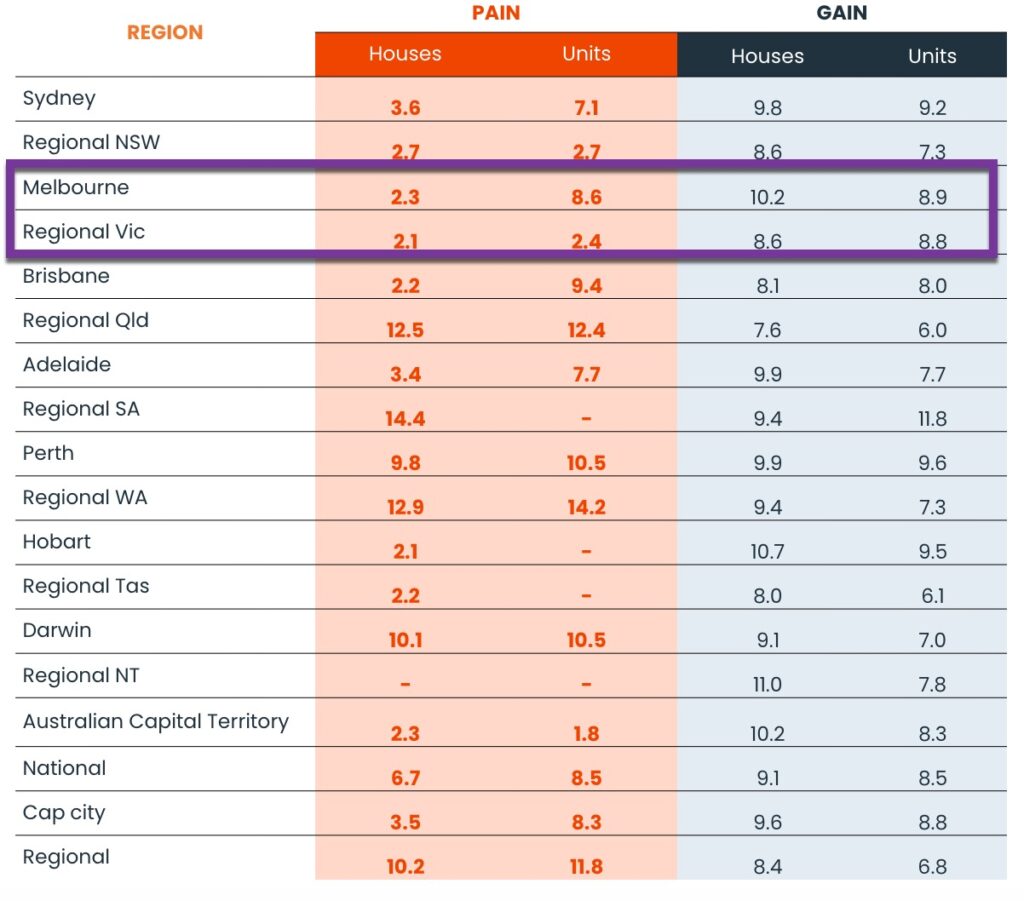
This chart below shows the median hold period (in years) for these profits and losses recorded. Unsurprisingly, the pains for house sales correlate with very short tenures. This could be explained by the sea-changers and tree-changers who transacted during COVID. Anecdotally there have been many regretful purchases dating back to this period. Some purchases were irrational, (and made during a highly fuelled time when interest rates were the lowest in history, and when lockdowns caused erratic buyer behaviour). Other purchases were suitable at the time, but in response to employers calling all staff back to the office, the commute deems the distance unfeasible.
The figure that strikes starkly is Melbourne’s unit pain tenure. Eight and a half years of tenure seems grossly unfair for a loss-producing sale.
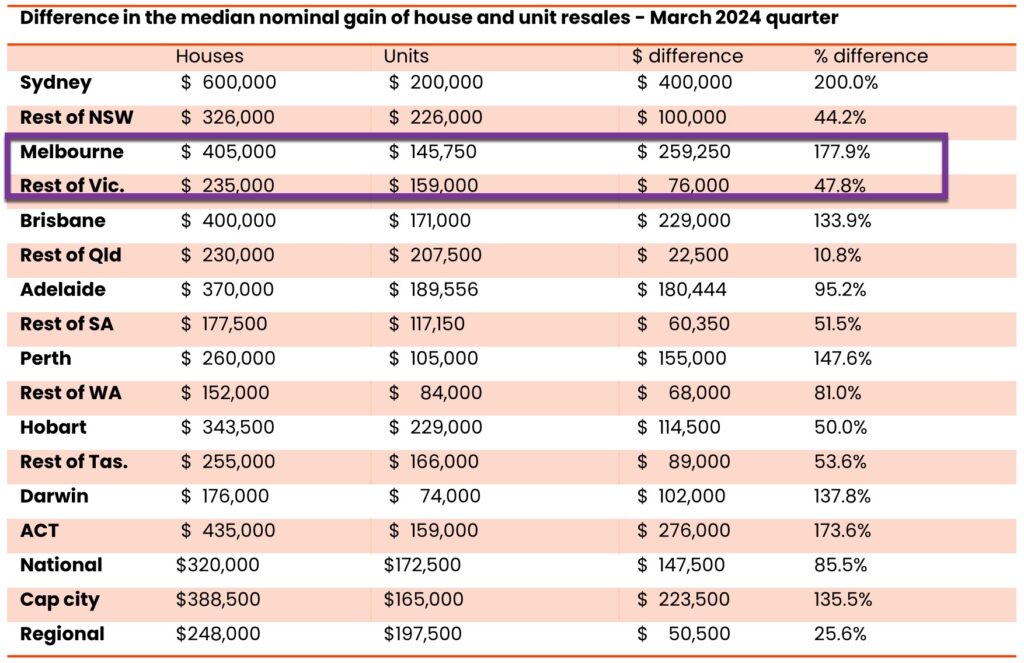
This chart below shows the percentage differential between house gains and unit gains. Surprisingly, for the city that boasts so many beautiful apartments, Sydney’s house sale profits outstrip unit profits by a whopping 200%.
Melbourne comes in second at 177.9%, closely followed by Canberra at 173.6%.
This means that house profits categorically outstripped unit profits substantially in these three cities.
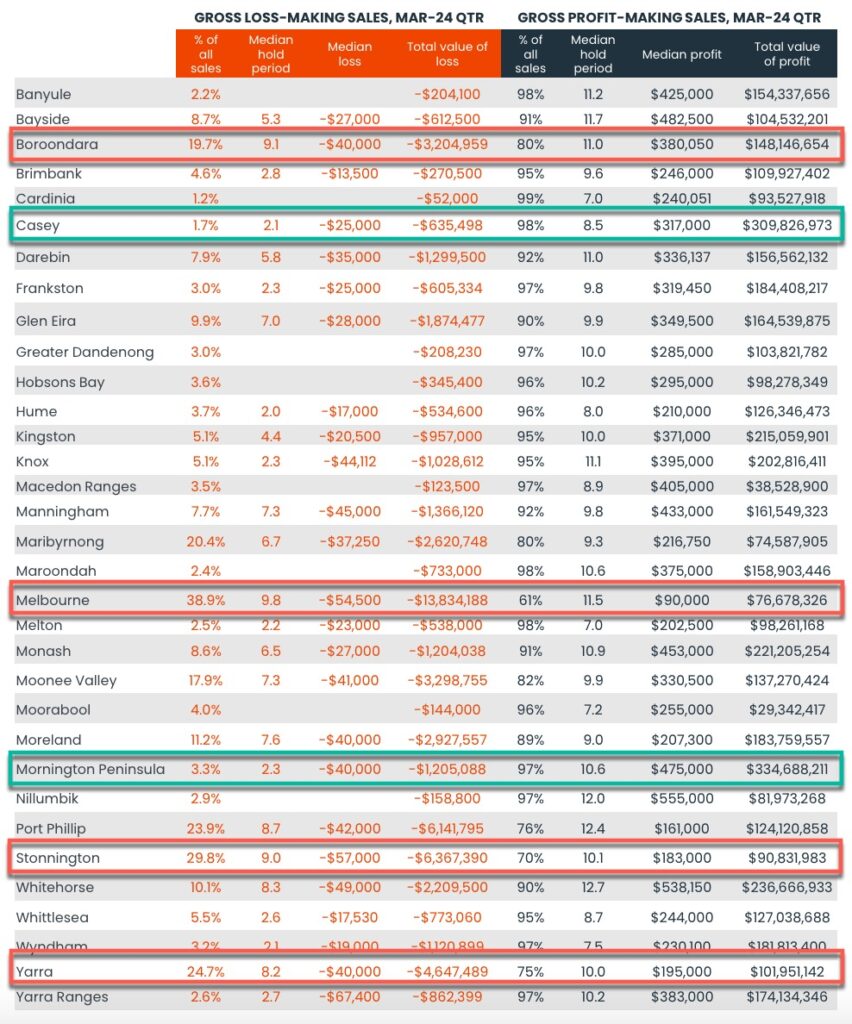
Locally, at a more granular level, this chart segments Victoria’s local government areas. I’ve highlighted the significant loss-producing locations in red. What’s really outstanding is the median held tenure for all four locales. Periods of long ownership in some of Melbourne’s most ‘blue chip’ locations are showing some dramatic losses.
The highest loss-producing location is Melbourne City council itself. This is most definitely attributed to the apartment market and would likely be a result of overpayments of new and off-the-plan sales, in tandem with an underperforming market segment.
Surprisingly, Casey and Mornington Peninsula display the strongest gains. Despite the Mornington Peninsula’s stellar rise in values during the pandemic, the losses anticipated following higher interest rates and return to the office are not filtering through (yet). Casey is also interesting, as this local government area incorporates a large number of house and land developments.
Circling back to the unit sales and the contrasting loss-producing sale count for Melbourne, it’s important to consider unit building approval figures. This chart below shows private sector unit approvals for the past forty years. The peak leading up to the pandemic had a significant negative impact on Melbourne apartment capital growth. Localised areas within our city had an oversupply issue and the pandemic exacerbated the issue when local buyers wanted more internal space and proximity to nature. The inner-city value surge immediately following the pandemic was testament to the pain invoked by lockdowns.
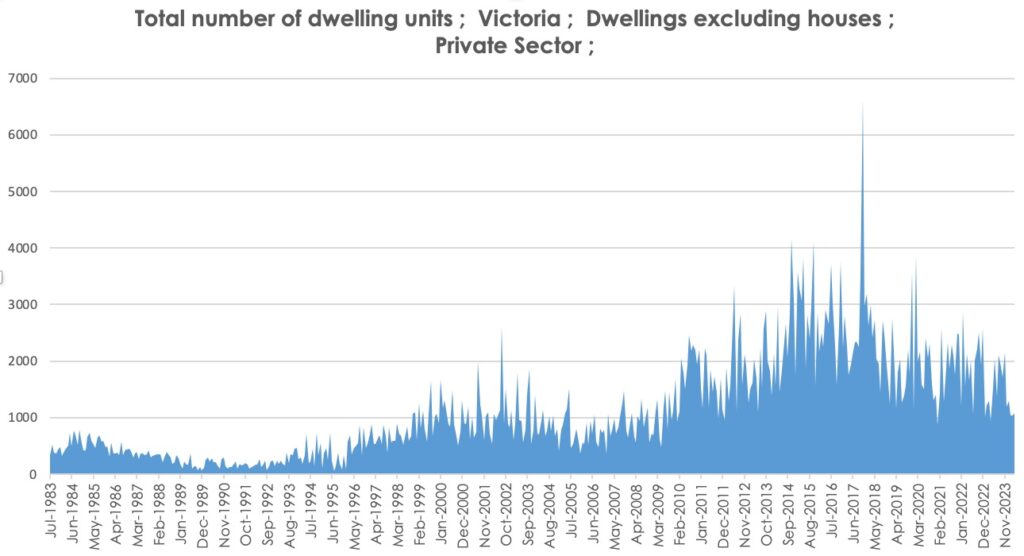
With dwelling approvals substantially lower now, it will be interesting to note the unit market loss-making sales in future quarters. I believe that the outlook for quality units in Melbourne will continue to improve.
Time will tell….
REGISTER TO OUR NEWSLETTER
INFORMATION
CONTACT US
1A/58 ANDERSON STREET,
YARRAVILLE VIC 3013
0422 638 362
03 7000 6026
CATE@CATEBAKOS.COM.AU