We all know of and understand lender interest rates. They come in a combination of formats depending on whether we are paying principal and interest, interest only, a fixed interest rate or a variable interest rate. Our interest component within our loan repayments schedules is the cost of borrowing the money.
The interest portion all goes to the lender.

There are tips and tools we can utilise to pay less interest to the lender over time. They include:
- Making extra repayments. We can either pay an additional amount per repayment schedule, or we can switch to fortnightly payments, (as opposed to monthly). Over time, the residual over-payments add up.
- Paying down a lump sum into the loan account, (some will find solace in knowing they have the redraw facility, although this is not my preferred option*).
- Utilising an offset account, (my favourite!)
As shown in this clever chart I found on moneyschool.org.au, it illustrates the power of additional repayments and debt retirement timeframes.
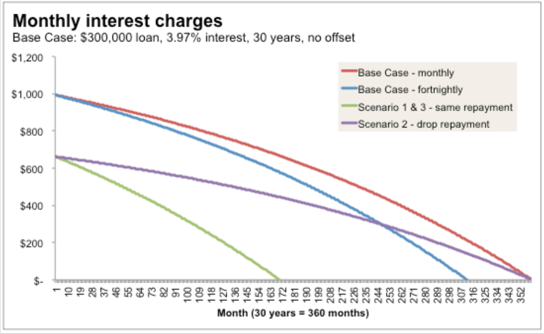
The red line shows the debt balance reducing from $300,000 to zero over a standard residential loan term of 30 years.
The blue line shows the impact of fortnightly repayments, as opposed to monthly. The loan is retired some five years earlier, just from one simple hack;
“Another subset of this option is to switch to fortnightly repayments that are half the value of a monthly repayment. This is like making 13 monthly repayments in the year instead of 12. It’s my favourite sneaky way to get ahead on mortgage payments.” – Lacey, MoneySchool
The purple line requires a net sum to be paid into the loan account to reduce the loan balance. If the mortgagor elects to run the loan term for the full 30 years, this line demonstrates the reduction in minimum monthly repayments.
The green line demonstrates what happens when the mortgagor makes the additional repayment and adheres to their original monthly repayment amount.
The loan is repaid significantly earlier.
A similar effect takes place when offset accounts are used effectively with monthly cashflow and savings channelled through this incredible, (and Australian-only) offering.
Residential loan interest rates vary, although we haven’t seen much variability of late because we’ve been stuck in a record low interest rate environment for some time now.
The cash rate is broadly driving this, but the financial institutions’ margins play a role, and the banking profits are influenced by several elements, not just bank greed.
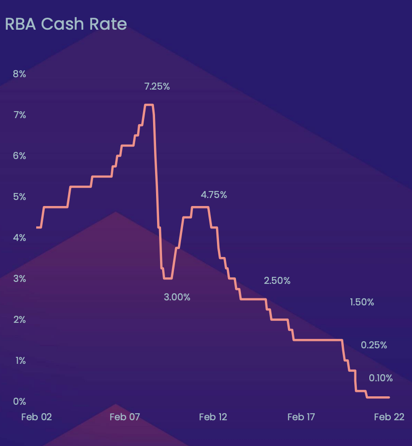
To explore the difference between the cash rate and the actual interest rate, these charts are helpful.
“A cash rate is the interest rate that a central bank – such as the Reserve Bank of Australia or Federal reserve – will charge commercial banks for loans. The cash rate is also known as the bank rate or the base interest rate.” – IG
Our current cash rate in Australia currently sits at a record low of 0.1%. Our last cash rate cuts were emergency cuts made in response to COVID-19 back in March 2020, where our RBA made not one, but two rate cuts in the one month. Since this time we’ve maintained the same record low rate.
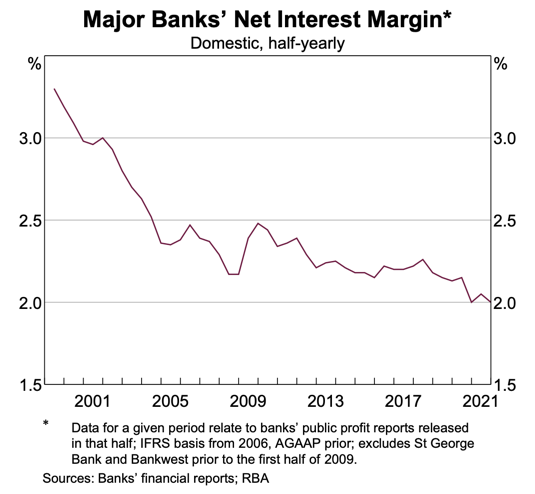
Competition, credit policy, funding costs, sources of deposits, exposure to various types of debt, balance sheets and many other factors play a part in the margins that our various lenders set for residential loan products. This chart below shows that net interest margins have declined over the past quarter of a century.
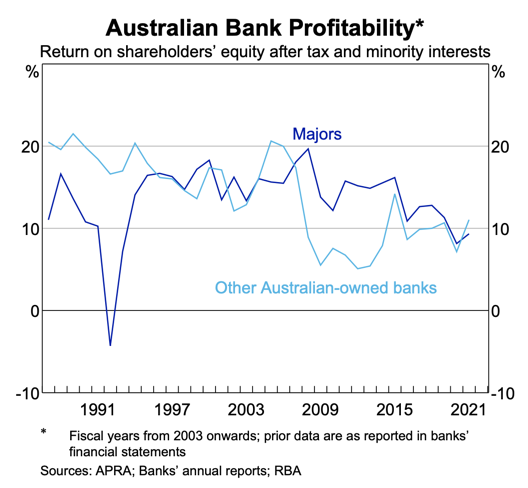
The profitability of Australian banks hasn’t necessarily had a direct correlation with profit margins on loans, illustrating the fact that so many other factors are at play; not just residential lending customers and domestic deposits. It is interesting to note the banking challenges we faced back in the early nineties highlighting the recession of the 1990’s when unemployment exceeded 10%.
If we fast-forward to present day, and in particular we focus on the the period of COVID-19 lockdowns and economic disruption, it’s interesting to see the growth in credit across all three platforms; owner-occupier housing, investor housing and (more recently) business.
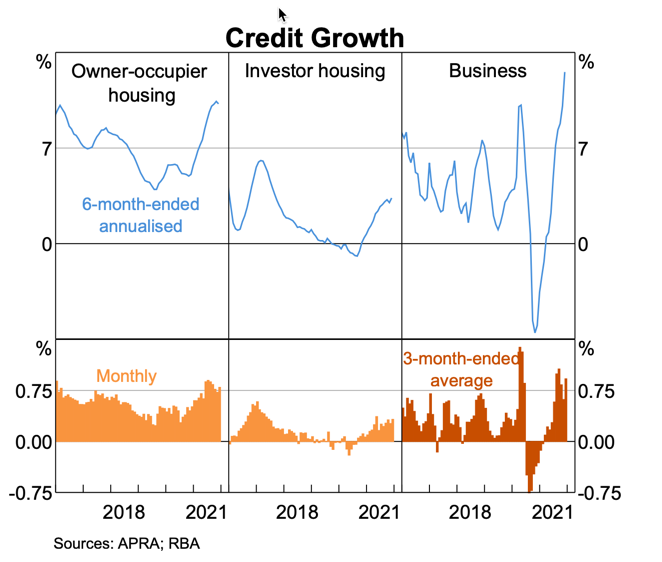
When we circle in on residential lending, our loosening of credit following the banking royal commission and credit squeeze between 2014-2019 is evident in the above chart. Our RBA’s efforts to keep fixed rates low for a period of time were palpable, with an increase in the adoption of fixed rates evident across both owner-occupier and investor lending. Now that our RBA have made a decision to cease the purchase of bonds, (originally initiated in 2020 as part of the COVID-19 monetary policy efforts) our fixed interest rates are no longer underpinned at record low levels.
This chart shows the upwards tilt on fixed interest rates, however if also shows that variable rates are still trending down.
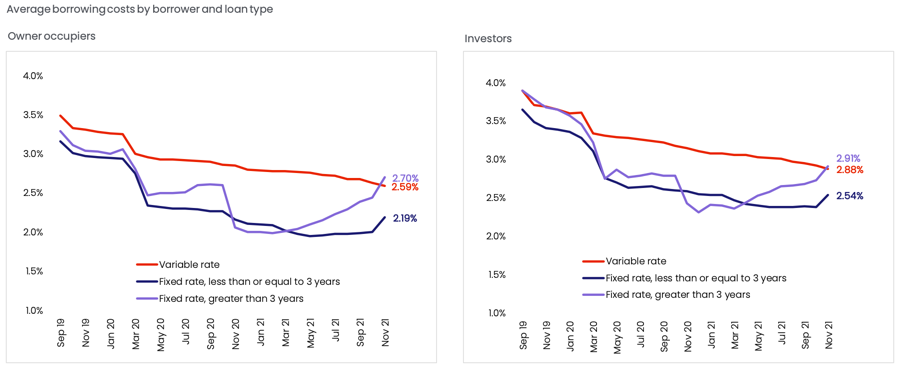
There is a stark difference between fixed interest rates and variable interest rates and funding for fixed needs to be understood, because the relationship between the cash rate, bank margin and actual rate is a direct relationship for variable, but indirect for fixed.
Since November 2021 we have seen an increase in the buffer rate, (also known as the assessment rate). In other words, the prescribed stress-tested rate that lenders require a borrower to be able to meet hypothetically, in the event of an increase in the cash rate and overall actual interest rate. Our buffer rate had been positioned around 7.5%-8% during the credit tightening period leading up to 2019, and buffers reduced to 5.5% by 2019, enabling heightened borrowing power for most residential housing borrowers. Immediately following the surprise federal election result in May 2019, our housing market picked up stride and exhibited sharp capital growth returns in response to higher borrowing levels across the nation.
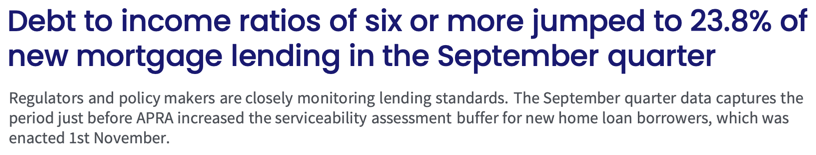
A buffer rate increase of a mere 50 basis points, (half a per cent) did alter things for some buyers, but the overall impact of this borrowing capacity blow has been minimal in most markets so far because not all buyers stretch themselves to the absolute constraints of their borrowing capacity.
In fact, most don’t.
While the buffer rate doesn’t impact actual repayments, it does limit the borrowing capacity for those who are taking their opportunity for credit to the edge of their capacity. We can anticipate a possible slow down in the high end markets and a reduction in price points for some investors, but at this stage, at our coal face we aren’t seeing a slow down in response to the macro-prudential changes initiated in late 2021.
Only time will tell in terms of how much more our credit is tightened, rationed and influenced by further macro-prudential changes.

REGISTER TO OUR NEWSLETTER
INFORMATION
CONTACT US
1A/58 ANDERSON STREET,
YARRAVILLE VIC 3013
0422 638 362
03 7000 6026
CATE@CATEBAKOS.COM.AU